About cost management in dbt Cloud betaEnterprise
This documentation is for a beta feature. The title, sections, and content within this doc may change frequently during the beta period. The final product may be split into multiple pages, and existing sections may be renamed. This page is intended for beta users only. Please do not share outside of your organization.
Cost management tools are currently only available for Snowflake.
The cost management dashboard in dbt Cloud give you valuable insight into how your dbt projects impact your data warehouse costs. They will help you optimize your warehouse spending by visualizing how features, including models, tests, snapshots, and other resources, influence costs over time so that you can take action, report to stakeholders, and optimize development workflows.
Currently, only Snowflake is supported.
This document will cover setup in Snowflake, dbt Cloud, and how to use the cost management dashboard to view your insights.
Prerequisites
To configure the cost management tools, you must have the following:
- Proper permission set to configure connections in dbt Cloud (such as account admin or project creator).
- Proper privileges in Snowflake to create a user and assign them database access.
- A supported data warehouse. Note: Only Snowflake is supported at this time. More warehouses coming soon!
- An Enterprise dbt Cloud account
Set up in Snowflake
You must configure metadata credentials for each unique Snowflake account you want the cost management tool to monitor. To configure the proper access in Snowflake:
- Identify an existing or new (recommended) service user in your Snowflake account. We recommend configuring a new user for this service, for example,
dbt_cost_user, for more flexible customization. - Grant the user
readpermissions to theORGANIZATION_USAGEandACCOUNT_USAGEschemas.- (Optional) You can scope this down to the specific tables in the warehouse if preferred using a Snowflake database role assigned the following access:
ACCOUNT_USAGE.QUERY_HISTORYACCOUNT_USAGE.QUERY_ATTRIBUTION_HISTORYACCOUNT_USAGE.ACCESS_HISTORYACCOUNT_USAGE.WAREHOUSE_METERING_HISTORYORGANIZATION_USAGE.USAGE_IN_CURRENCY_DAILY
- (Optional) You can scope this down to the specific tables in the warehouse if preferred using a Snowflake database role assigned the following access:
To create a user dbt_cost_user and a role dbt_cost_management using SQL and assign the required permissions over specific tables, you'd execute something that looks like the following example:
CREATE USER dbt_cost_user
  PASSWORD = 'A_SECURE_PASSWORD'
  DEFAULT_ROLE = dbt_cost_management
  MUST_CHANGE_PASSWORD = FALSE;

CREATE ROLE dbt_cost_management;

GRANT ROLE dbt_cost_management TO USER dbt_cost_user;

GRANT USAGE ON DATABASE SNOWFLAKE TO ROLE dbt_cost_management;
GRANT USAGE ON SCHEMA SNOWFLAKE.ACCOUNT_USAGE TO ROLE dbt_cost_management;

GRANT SELECT ON VIEW SNOWFLAKE.ACCOUNT_USAGE.QUERY_HISTORY TO ROLE dbt_cost_management;
GRANT SELECT ON VIEW SNOWFLAKE.ACCOUNT_USAGE.QUERY_ATTRIBUTION_HISTORY TO ROLE dbt_cost_management;
GRANT SELECT ON VIEW SNOWFLAKE.ACCOUNT_USAGE.ACCESS_HISTORY TO ROLE dbt_cost_management;
GRANT SELECT ON VIEW SNOWFLAKE.ACCOUNT_USAGE.WAREHOUSE_METERING_HISTORY TO ROLE dbt_cost_management;
For broader, account-wide access, you could assign IMPORTED PRIVILEGES to the user:
CREATE USER dbt_cost_user
  PASSWORD = 'A_SECURE_PASSWORD'
  DEFAULT_ROLE = dbt_cost_management
  MUST_CHANGE_PASSWORD = FALSE;

CREATE ROLE dbt_cost_management;
GRANT IMPORTED PRIVILEGES ON DATABASE SNOWFLAKE TO ROLE dbt_cost_management;
GRANT ROLE dbt_cost_management TO USER dbt_cost_user;
If you prefer, you can also configure the user for key pair authentication instead of using a username and password with dbt Cloud.
You must repeat the user creation process in each Snowflake warehouse you want to monitor.
Once the user is created and assigned proper privileges, it's time to configure the connection in dbt Cloud.
Set up in dbt Cloud
To configure the metadata connection in dbt Cloud:
-
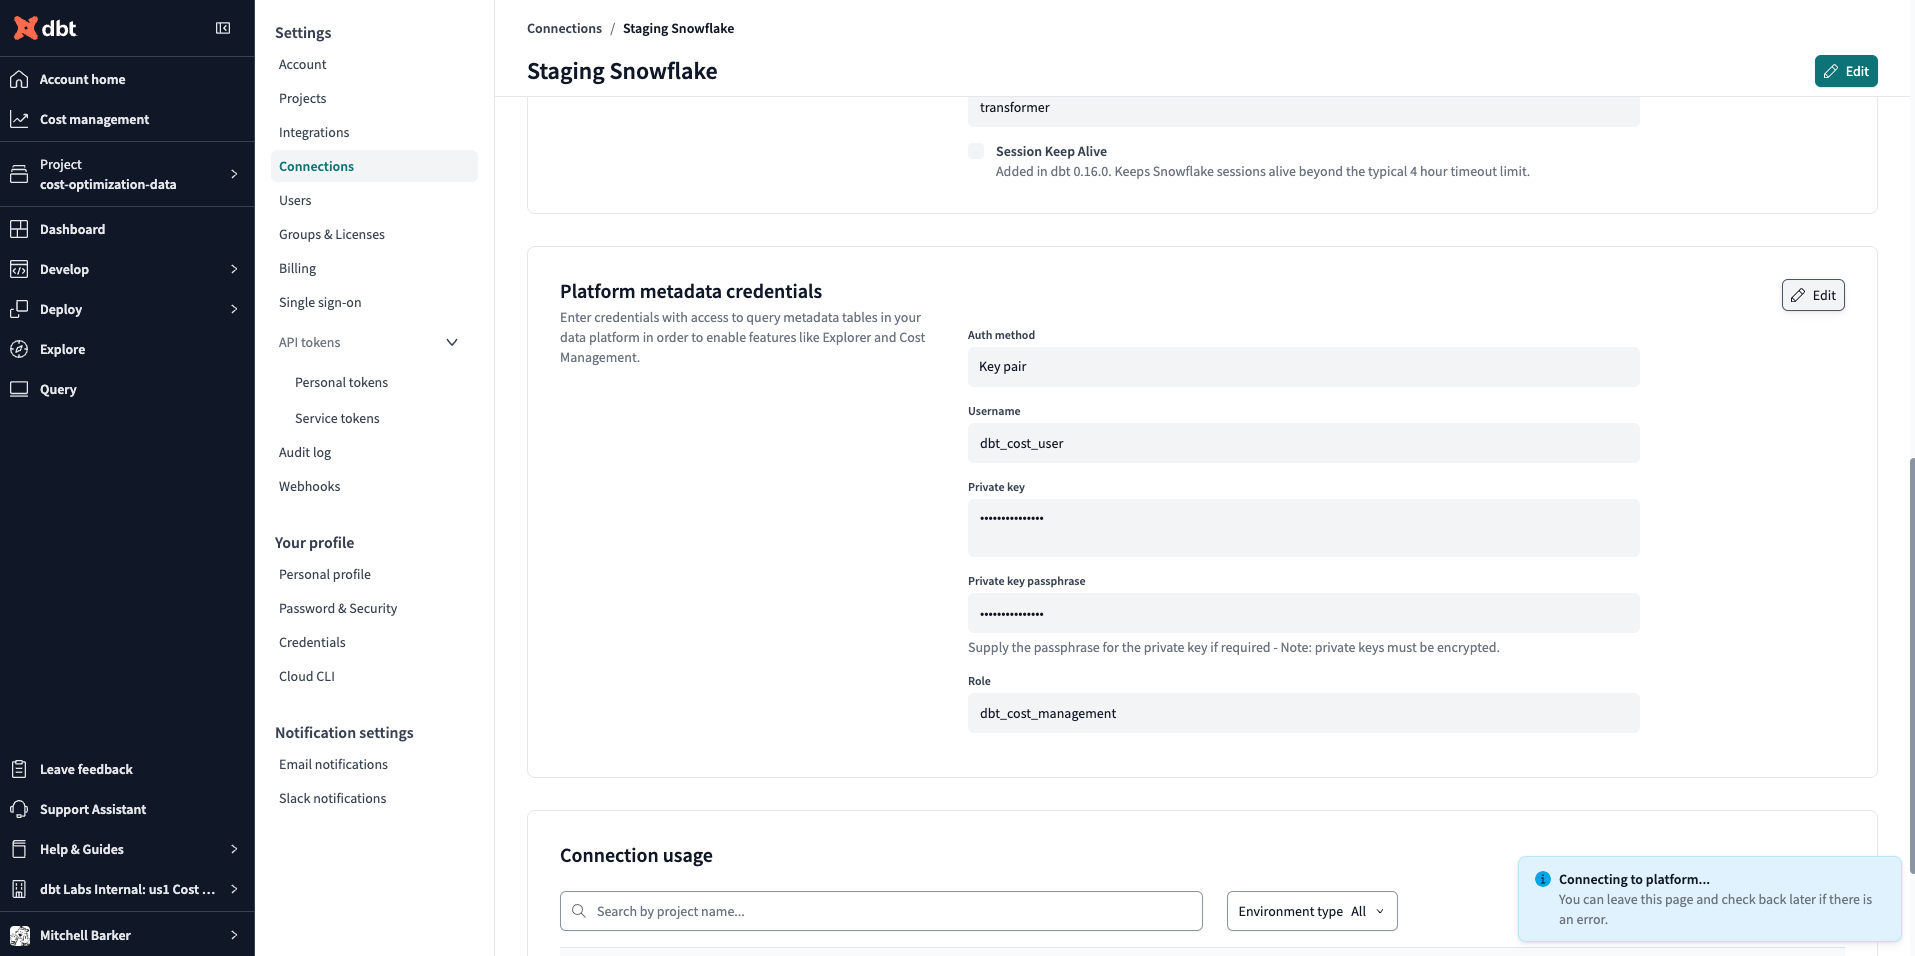
Navigate to Account Settings and click Connections.
-
Click the connection associated with the data warehouse(s) you configured in the Snowflake setup. Do not click Edit. This is for the broader settings and will prevent the metadata section from being altered.
-
Scroll down to the Platform metadata credentials and click Add credentials.
-
Set the appropriate Auth method (username and password or key pair) and fill out all the fields provided.
-
Click Save.
-
Repeat this process for each dbt Cloud warehouse connection you want to monitor.
After the setup, it will be a few hours before the initial sync completes and information begins to populate the dashboard.
Cost management dashboard
The cost management dashboard can be accessed anywhere in dbt Cloud from the left-side menu. Once enabled, Cost management will be an option below the Account home feature at the top of the sidebar. Users who don't have the proper permissions will not see the option.
Users with the following permission sets will be able to access the cost management dashboard:
- Account Admin
- Account Viewer
- Cost Management Admin
Since the dashboard contains sensitive financial information, we're introducing a new permission set to help you regulate access: Cost Management Admin.
You can optionally assign this permission set to the users or groups you want to have access to the dashboard instead of granting broader access with the other roles. Project-level access is coming soon via a new role, Cost Management Viewer.
Once the information syncs, you will see the results by selecting the Cost management dashboard option from the left-side menu.
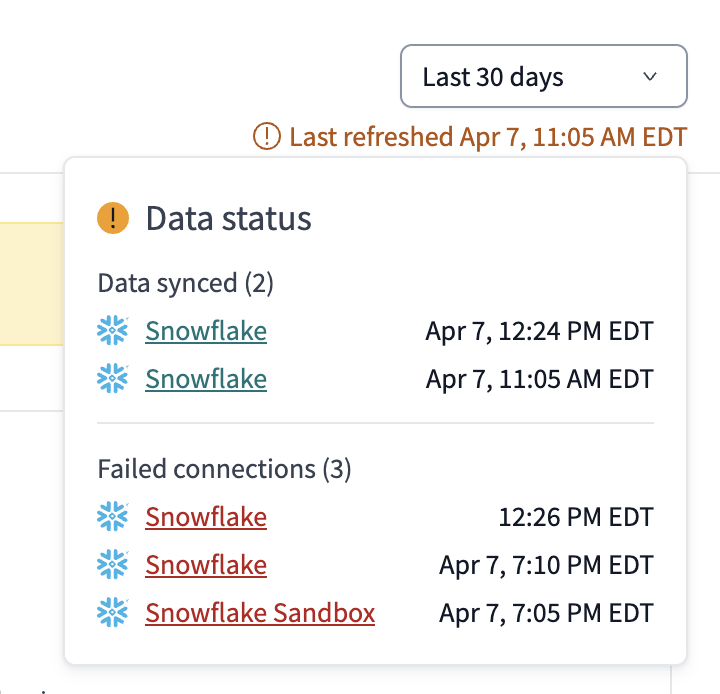
- Hover over the Last refreshed... date to see a list of your configured connections and their status.
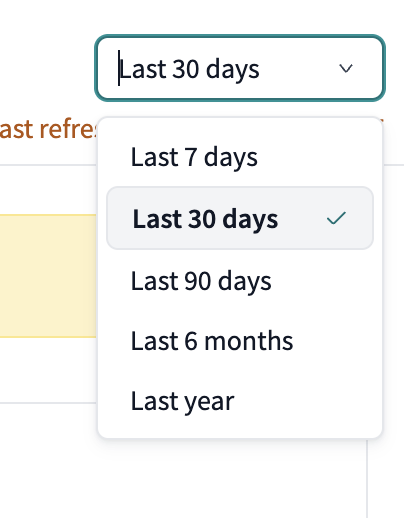
- Adjust the period you want to monitor.
Metrics
There are metrics that will be available to view and measure your costs as you navigate the dashboard. As you filter your dashboard, you will have access to a list view that enables you to sort by these metrics. The following metrics are available in the cost management dashboard:
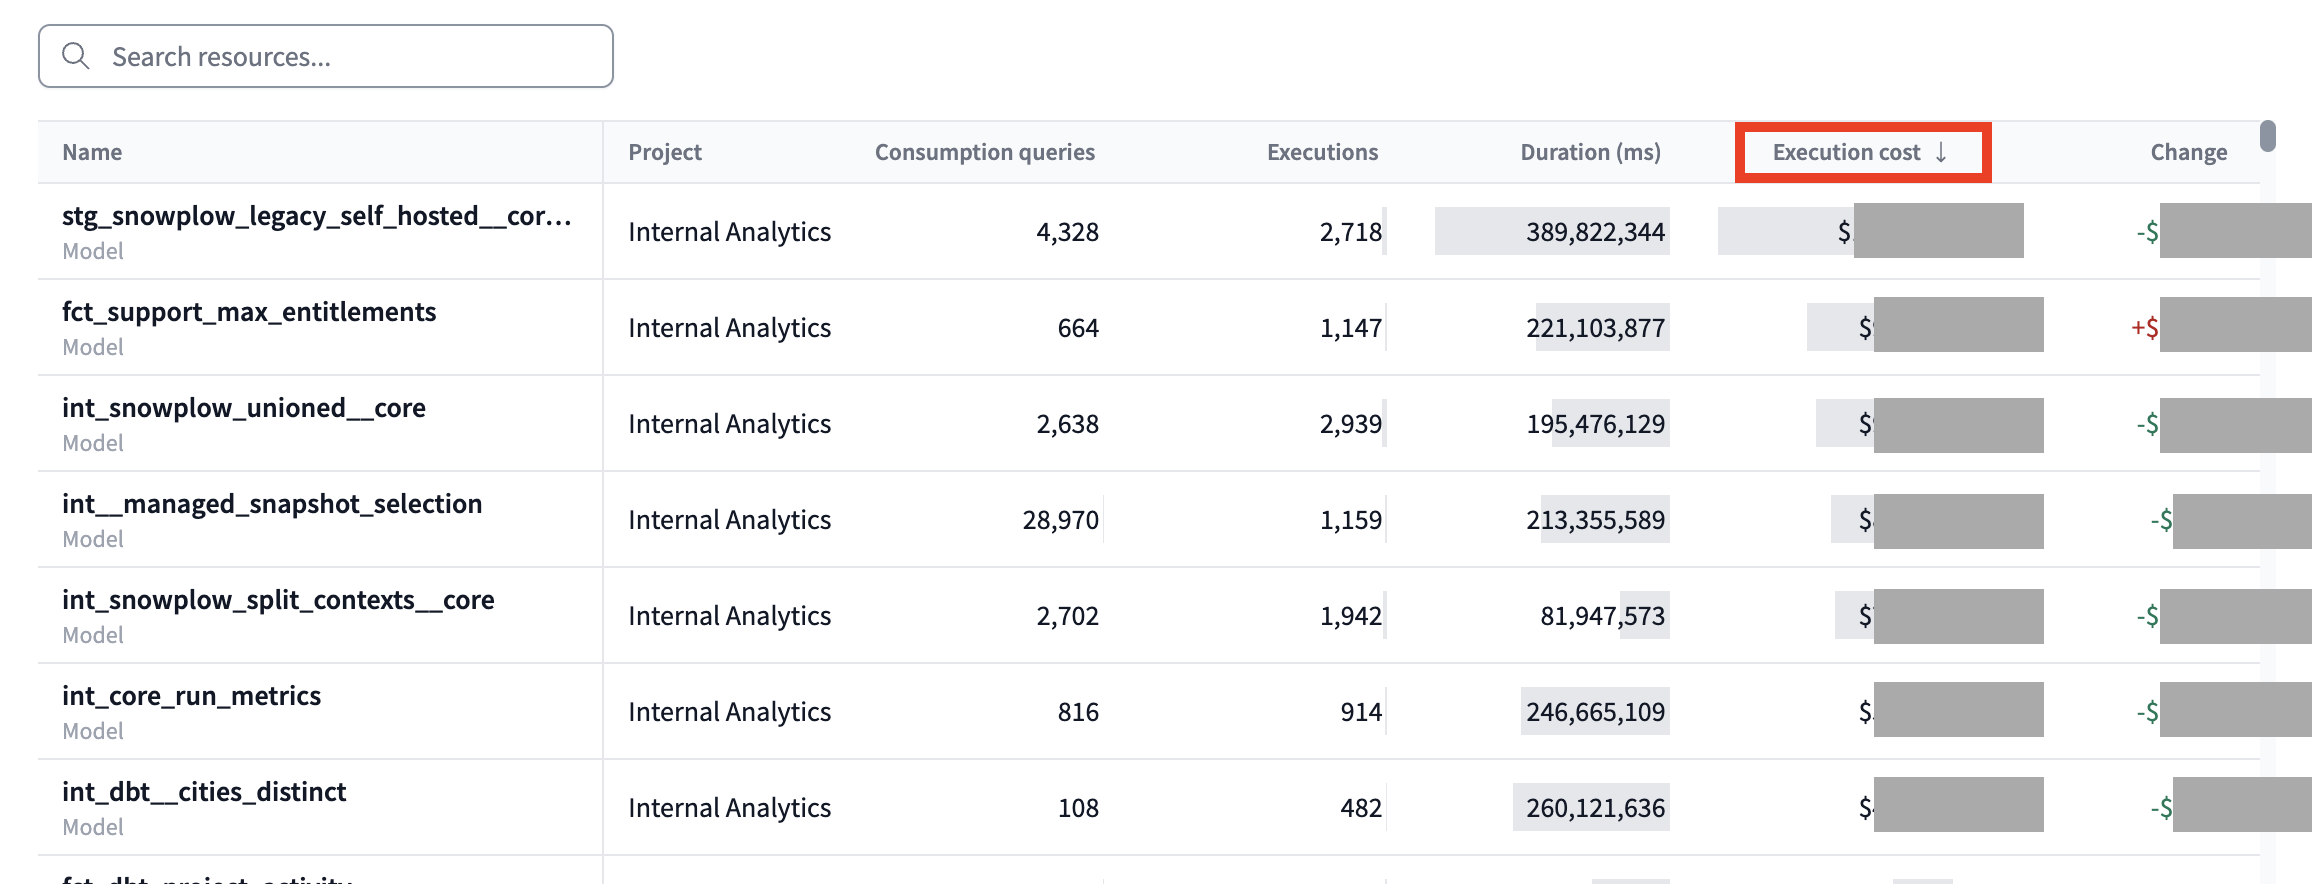
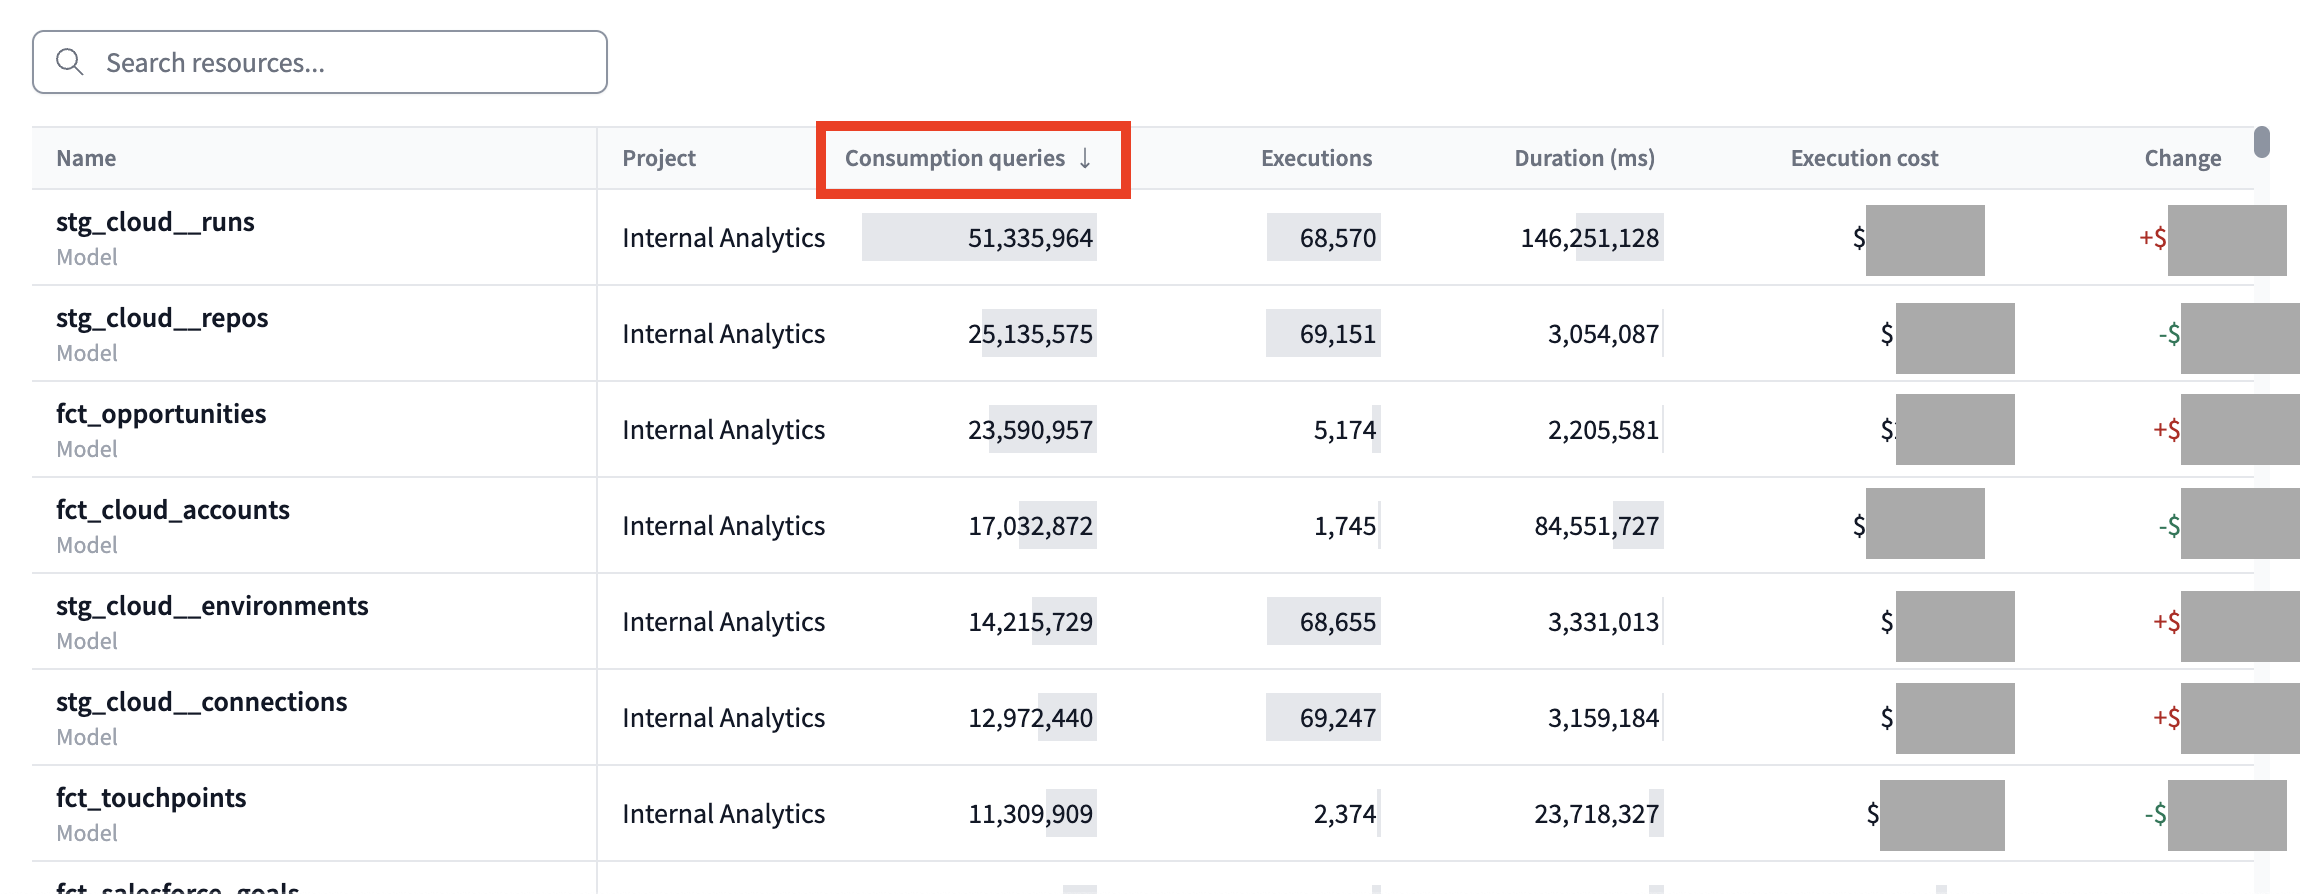
- Execution queries: The total number of queries run within the data warehouse by executing dbt resources (model builds, tests, etc.).
- Consumption queries: The total number of queries of given resource across all usage in the warehouse (includes BI/analytics tools, query consoles, etc.)
- Execution costs: The total warehouse cost associated with the resource(s) being executed in dbt runs.
- Duration (resource view only): The total duration of queries that executed dbt resources over the time period.
You can sort the list views by these metrics to see how resources are impacting individual areas and have quick views into your highest cost areas
Overview
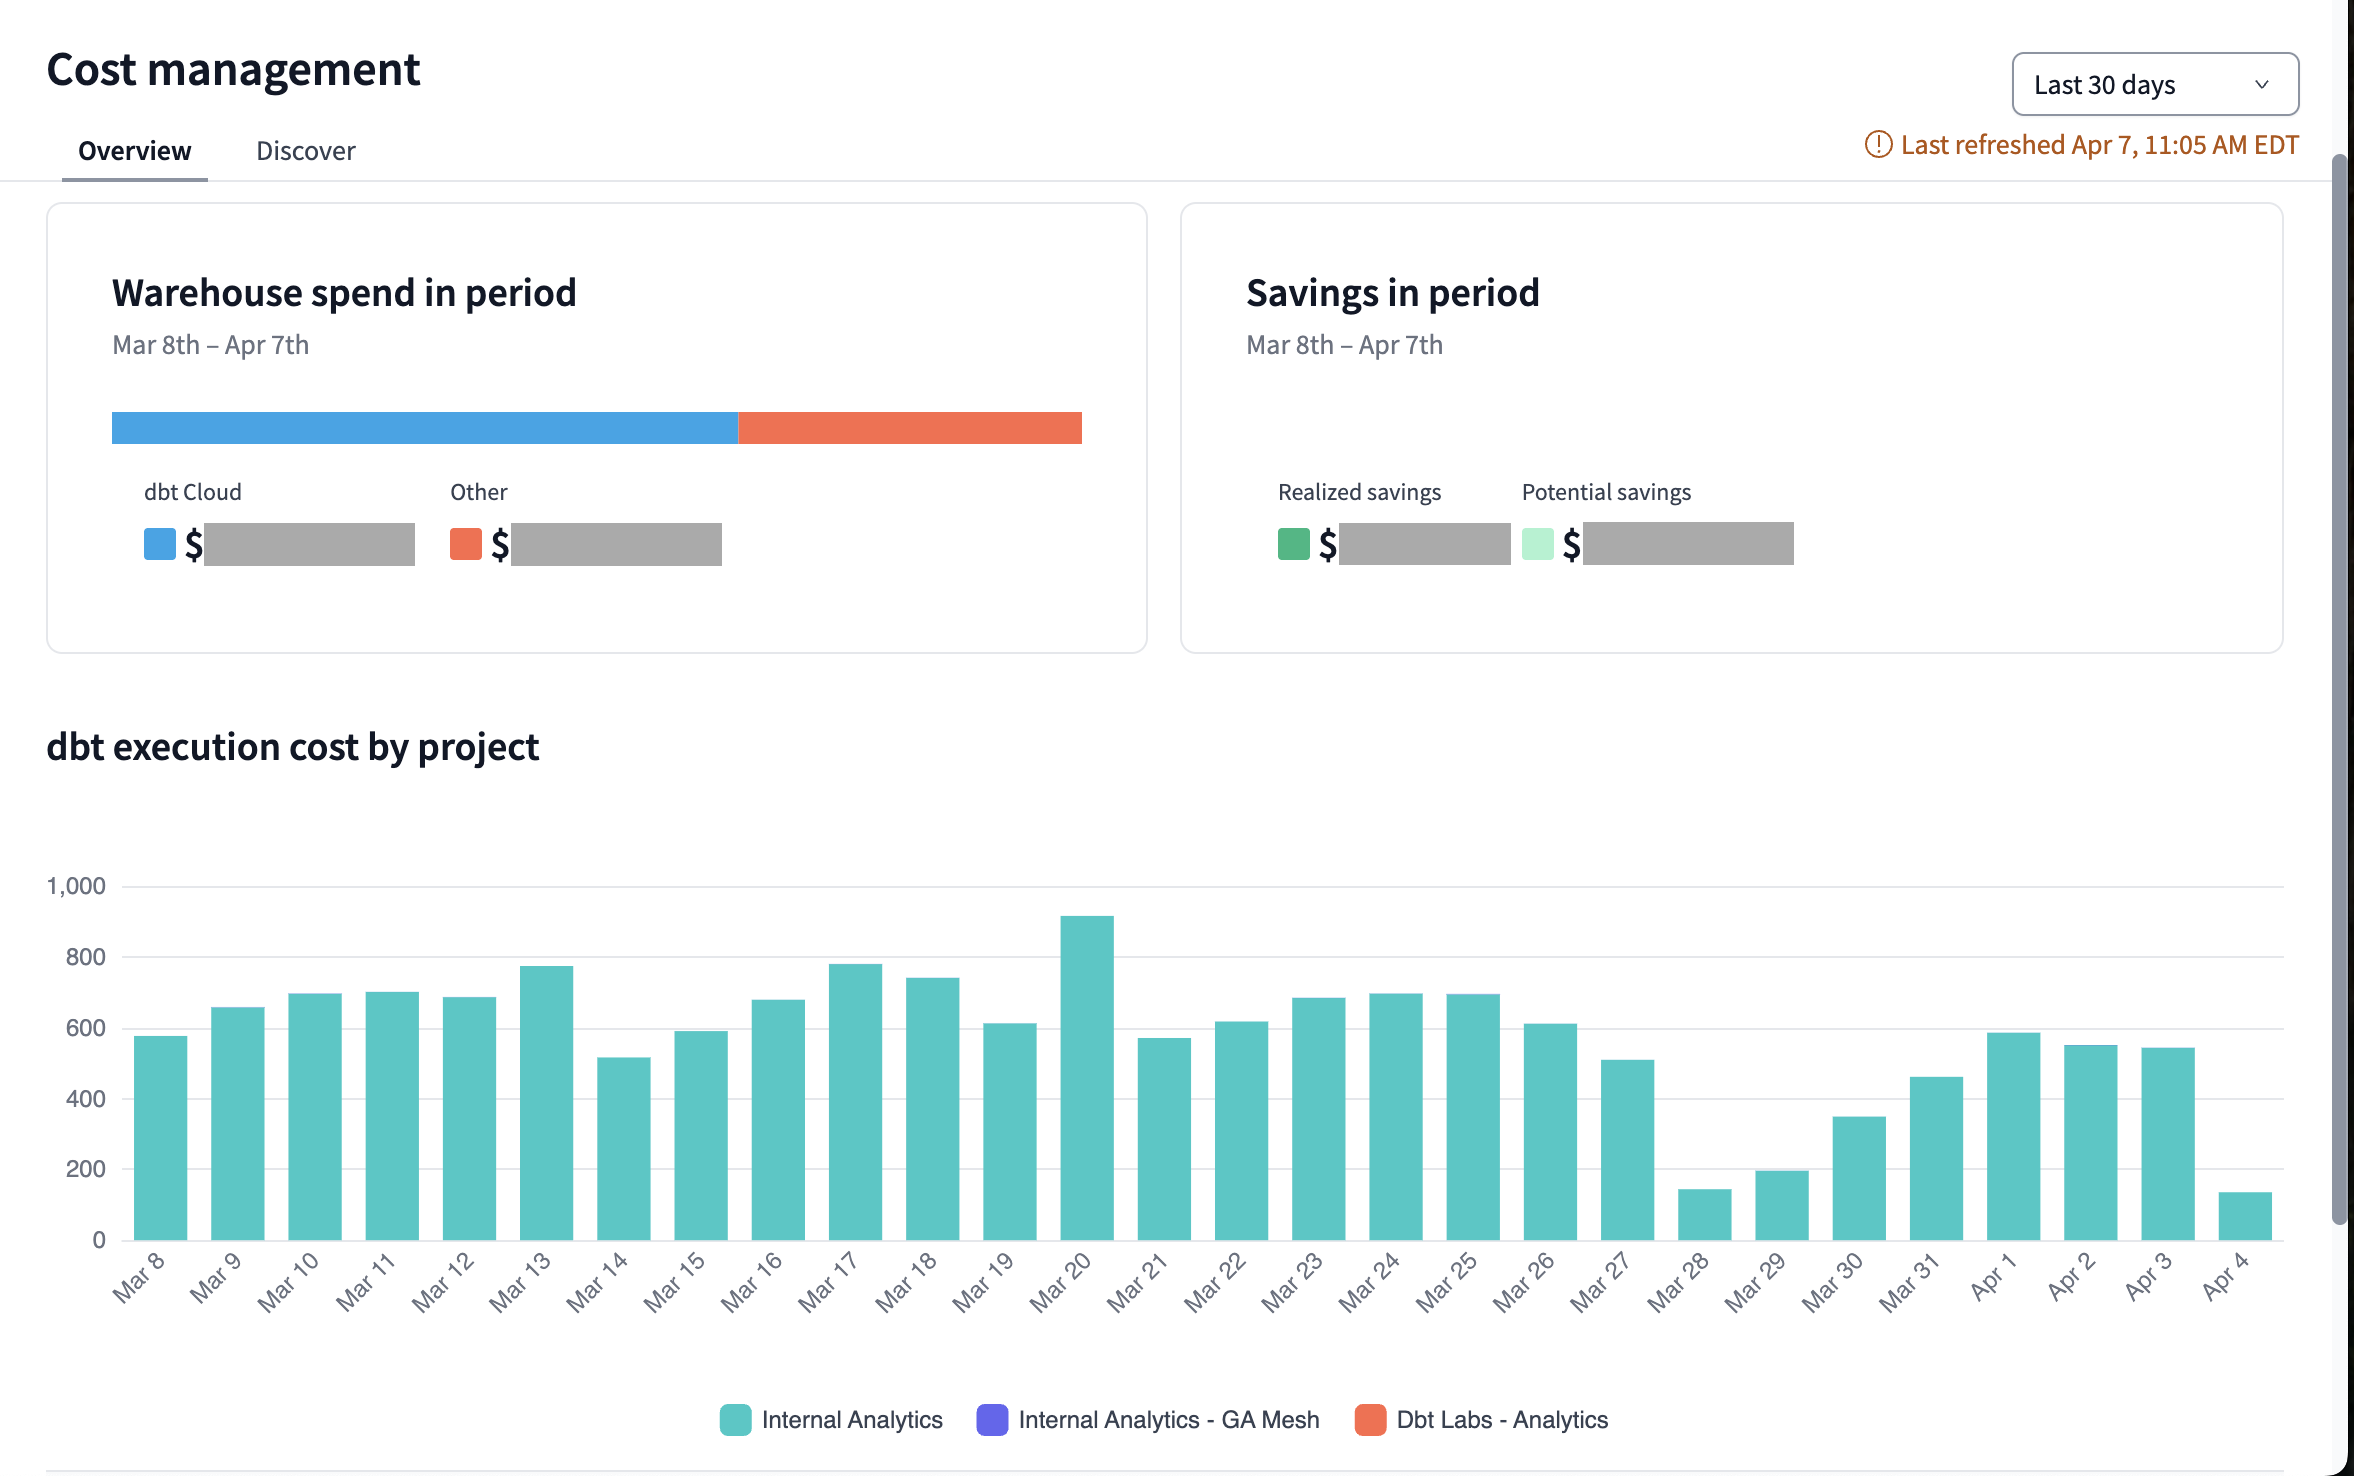
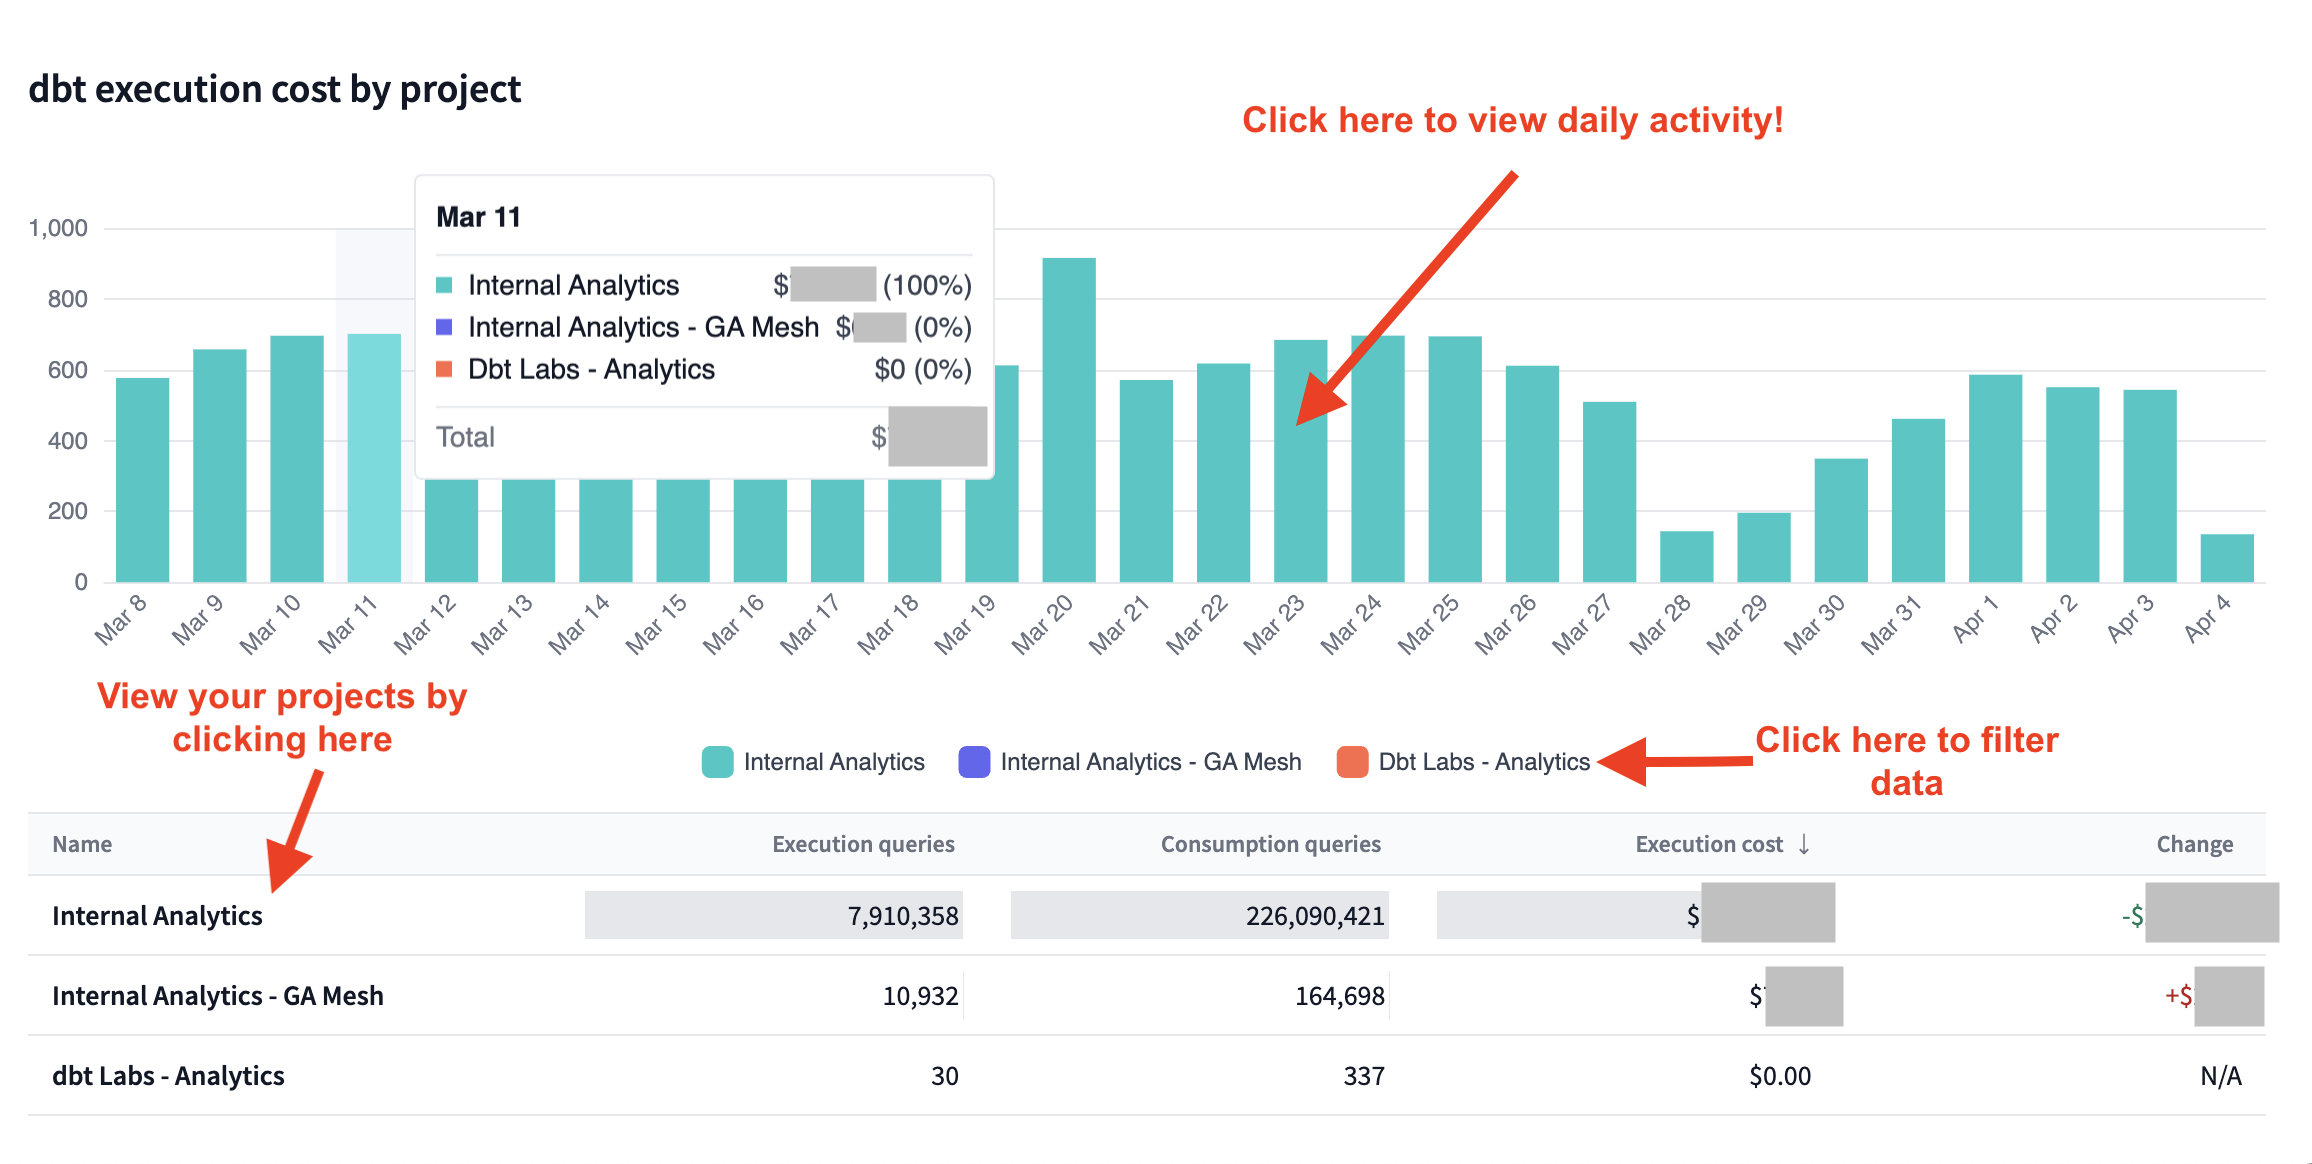
The Overview dashboard is the first display you'll see. It gives you general information about your costs:
- The top tiles display spend and savings over the selected period.
- The bar chart breaks down costs of dbt execution by project. You can click on the individual bars to view more information.
You'll be brought to the Discover tab when you click on a bar or project. Here, you can view more detailed information about your spending.
Discover
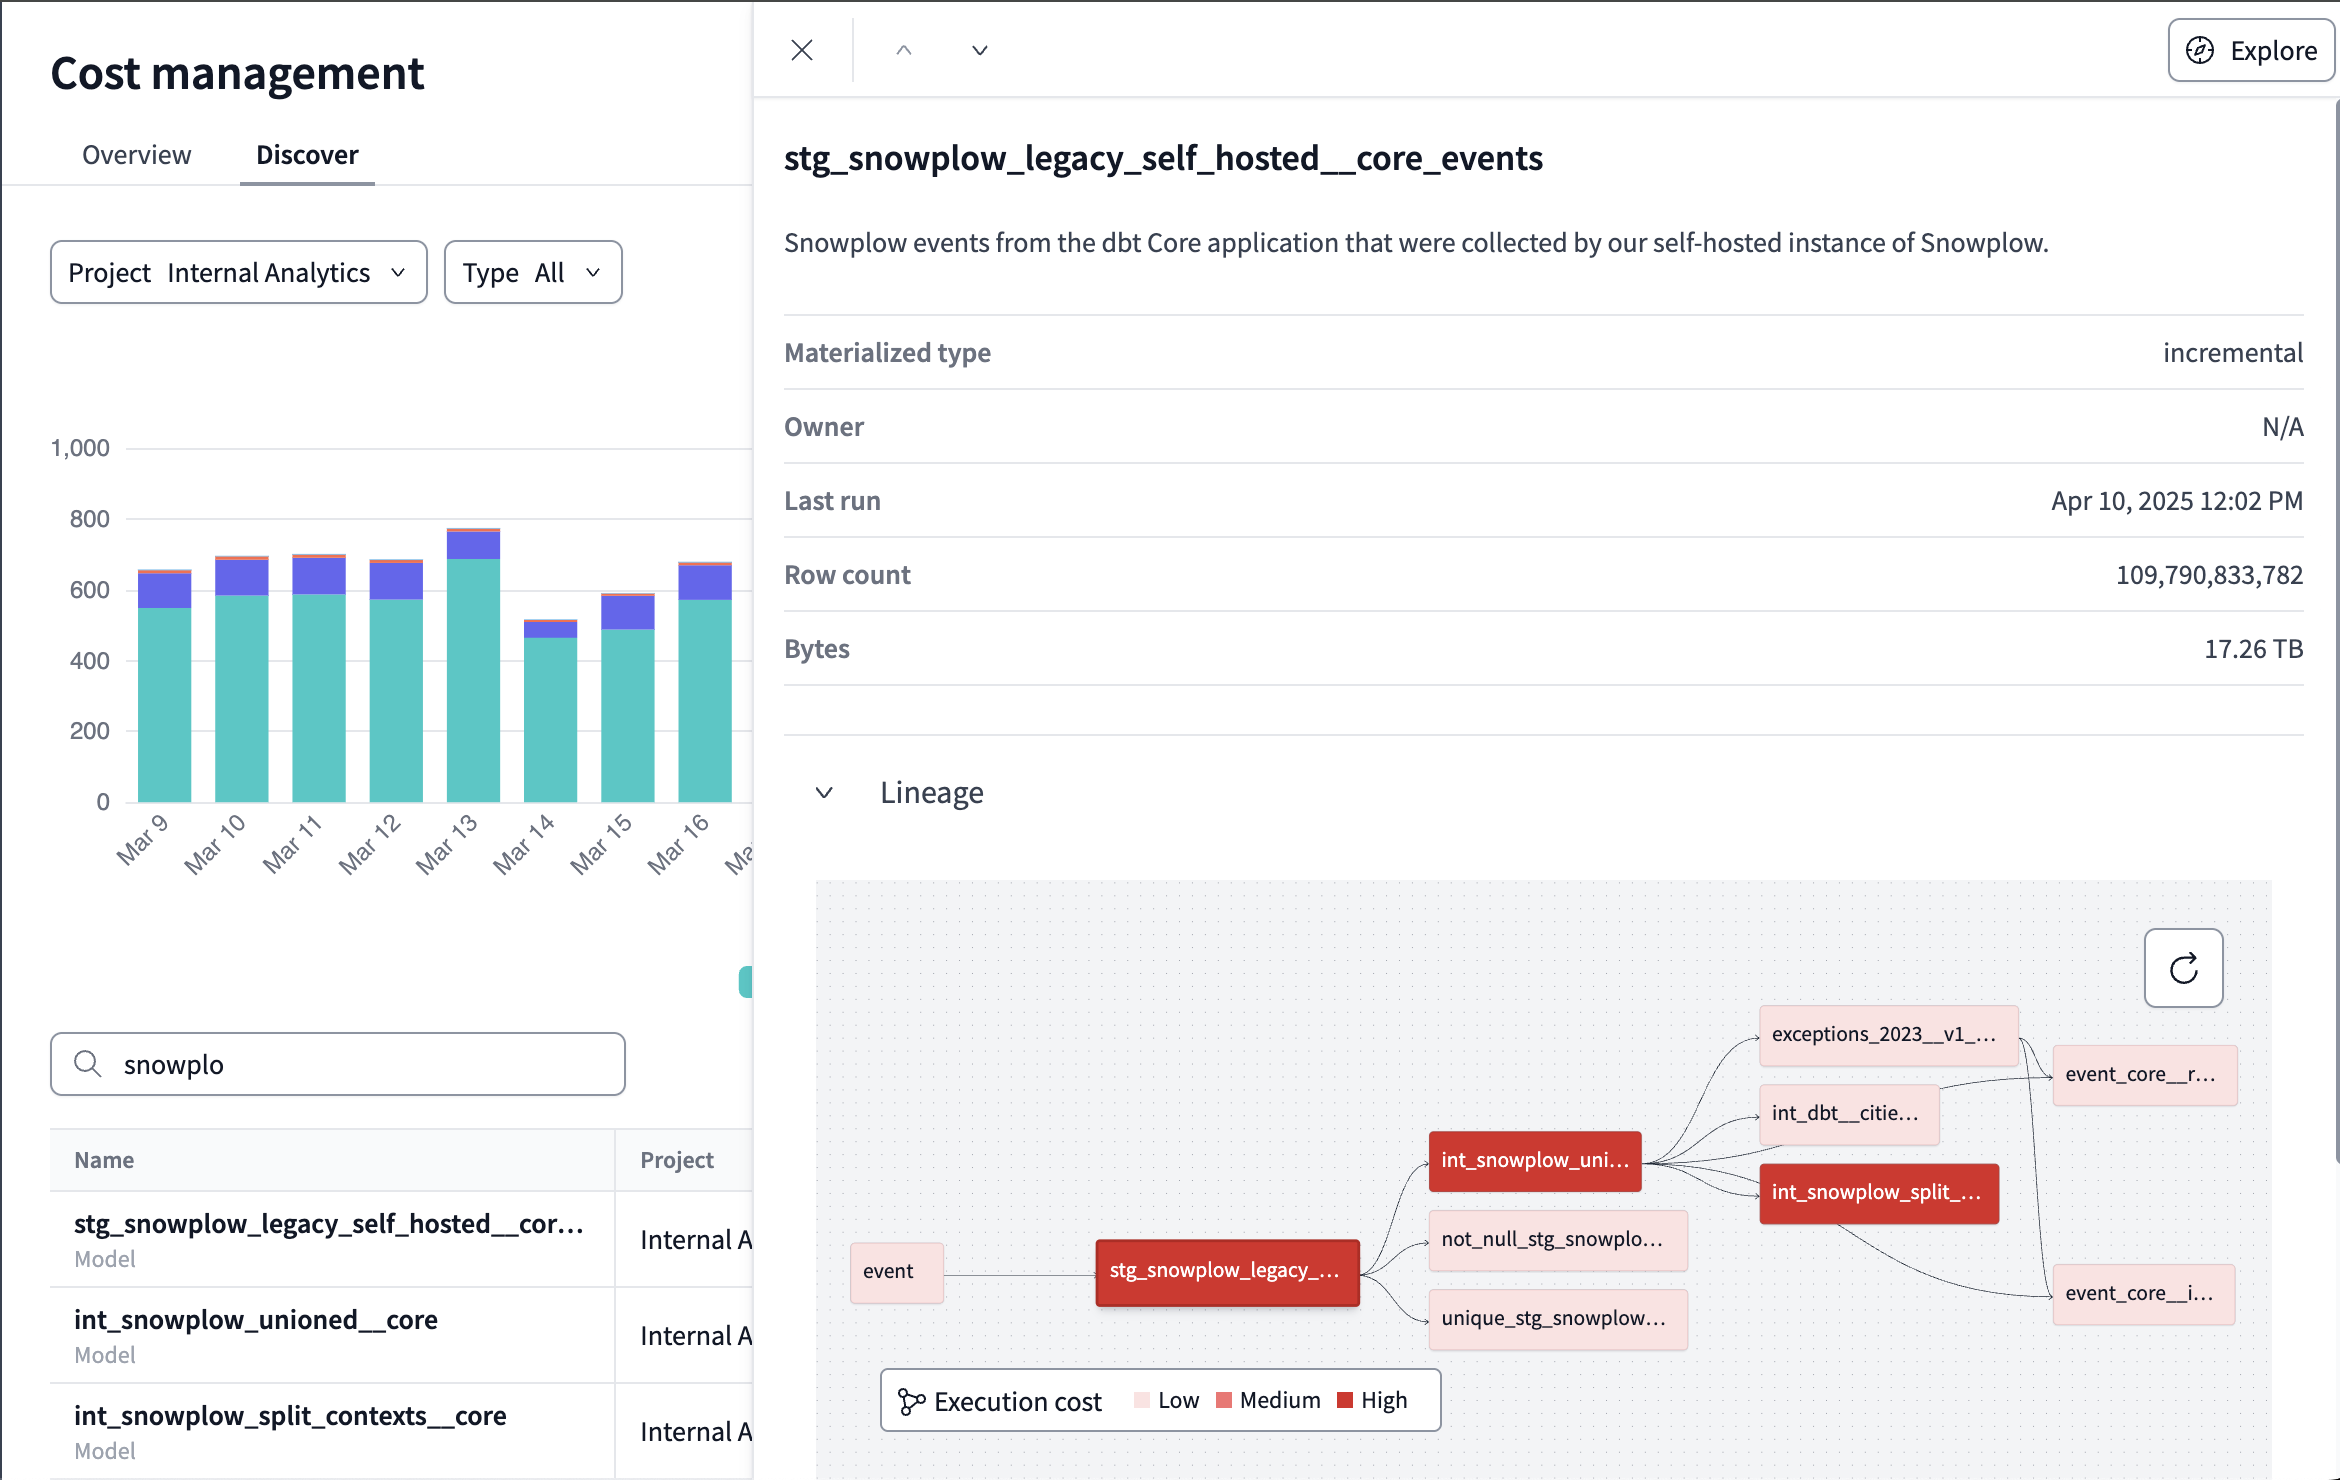
The Discover tab takes you to a pane where you can really start getting granular with your cost analysis. It is an interactive page that allows you to break down costs by project, resource, date, and various combinations of those. You'll be able to monitor specific notes in your project lineage to see which resources are impacting your spending the most and view the metadata specific to those resources.
There are multiple options for filtering the cost data views with two starting points
-
Resources
-
Environments
Resource view
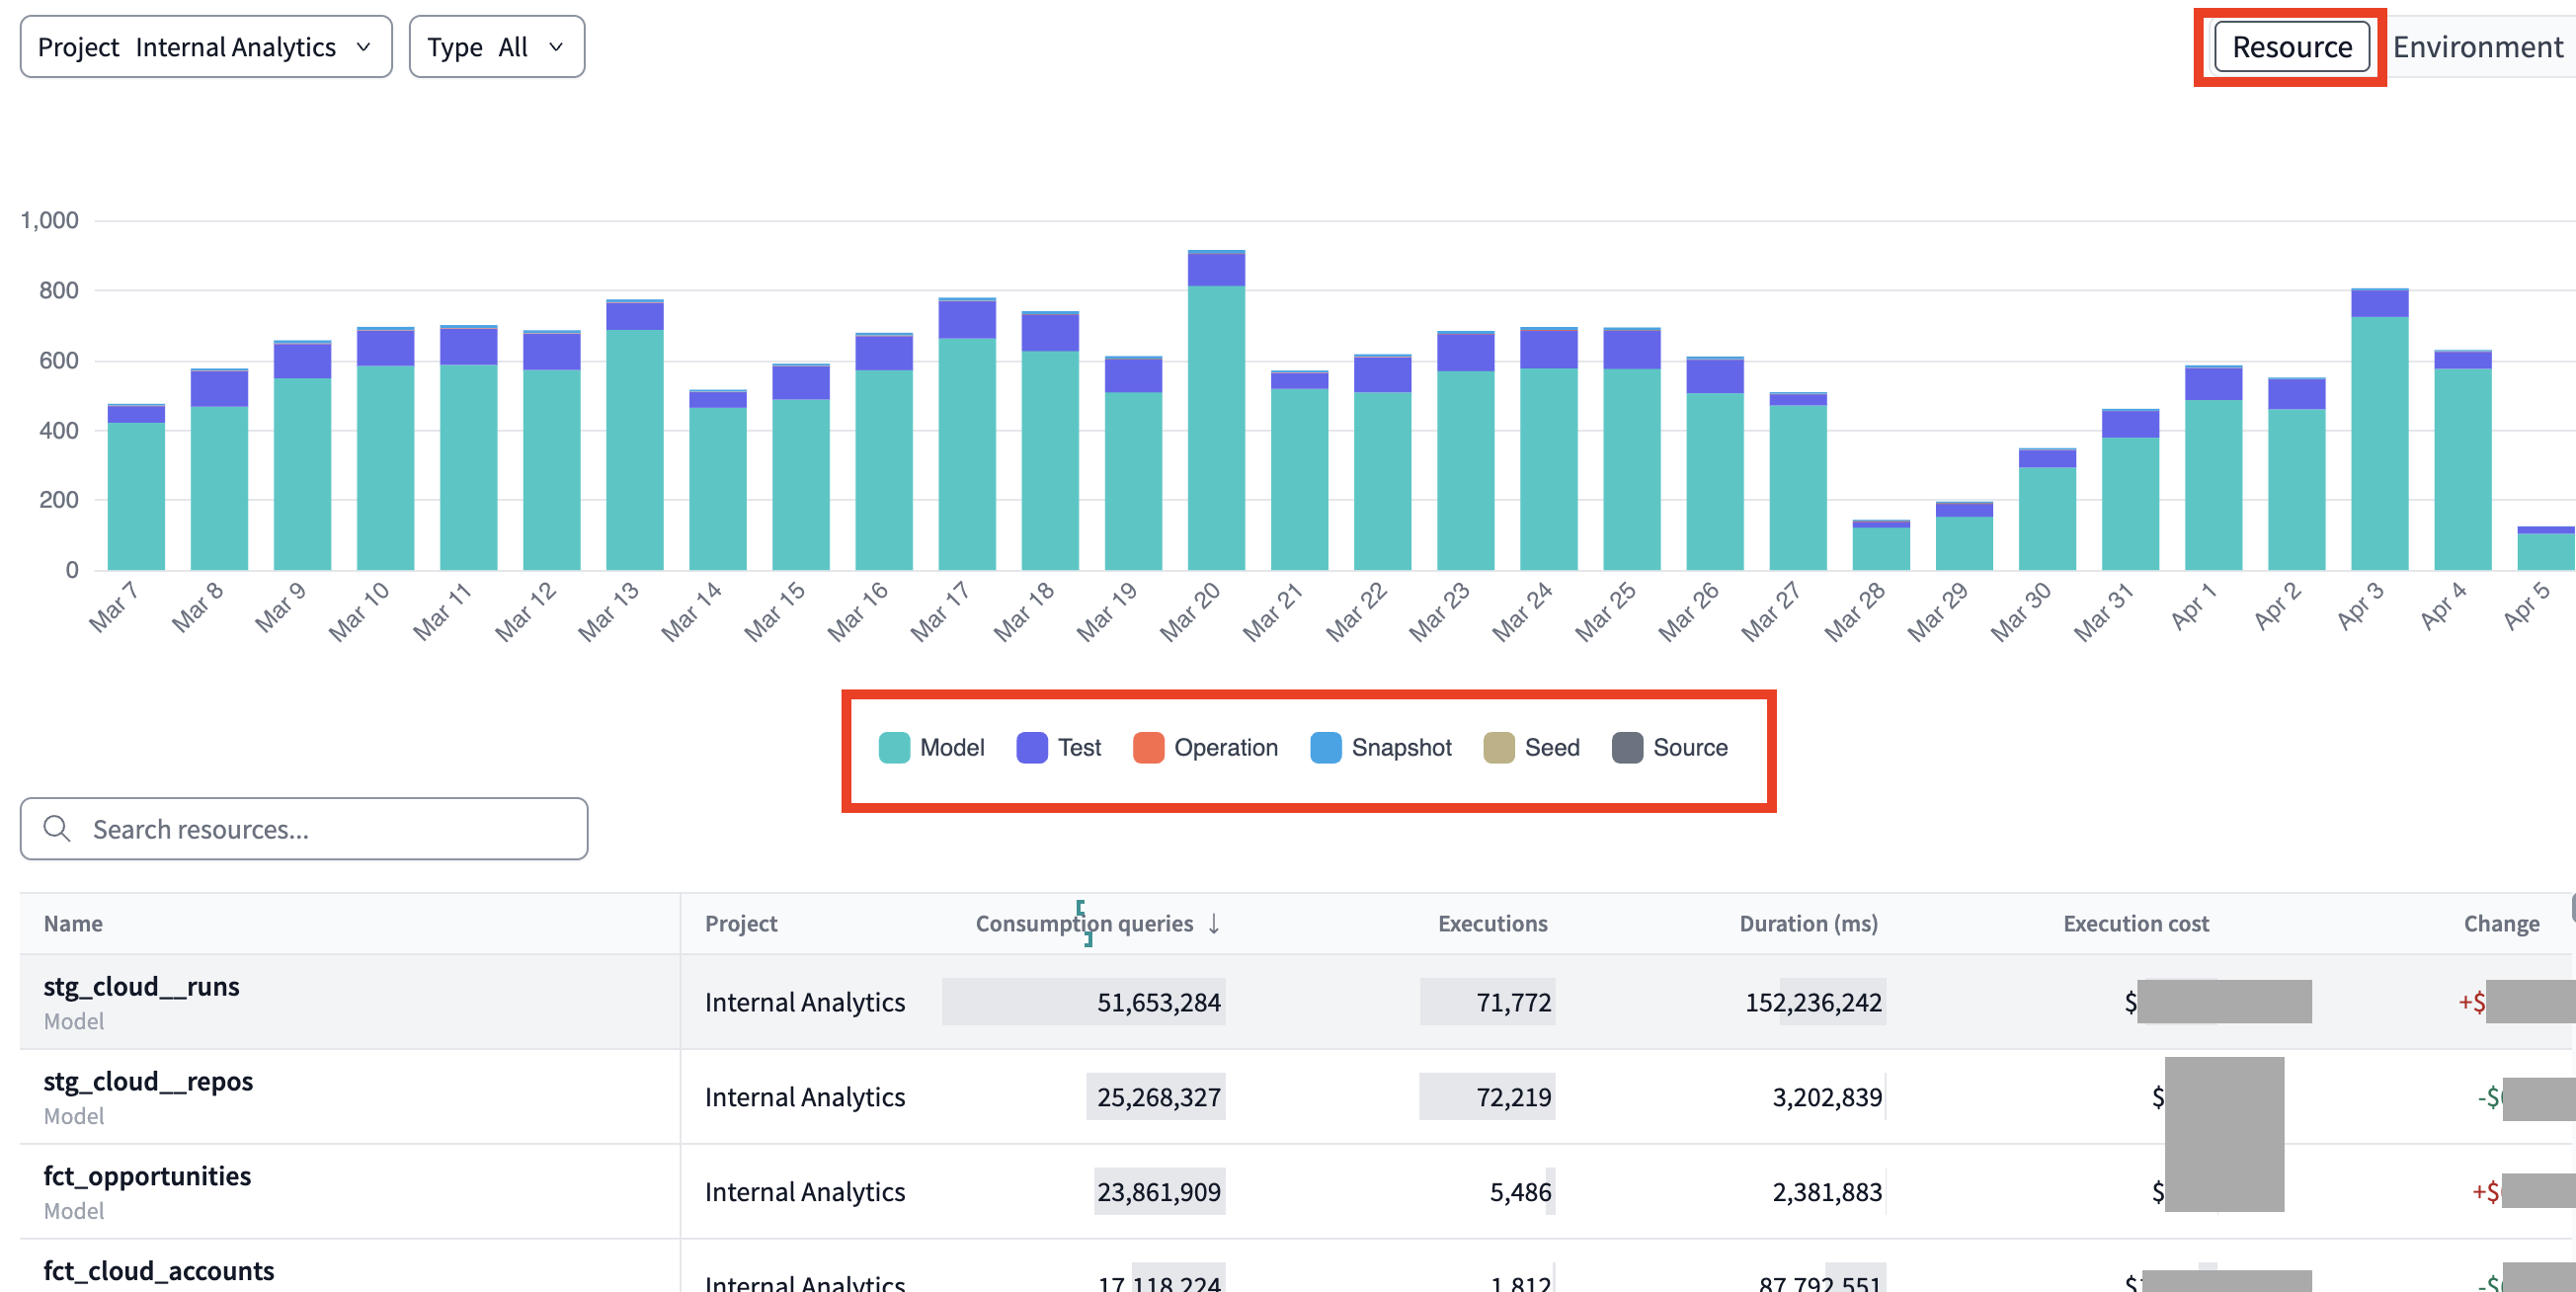
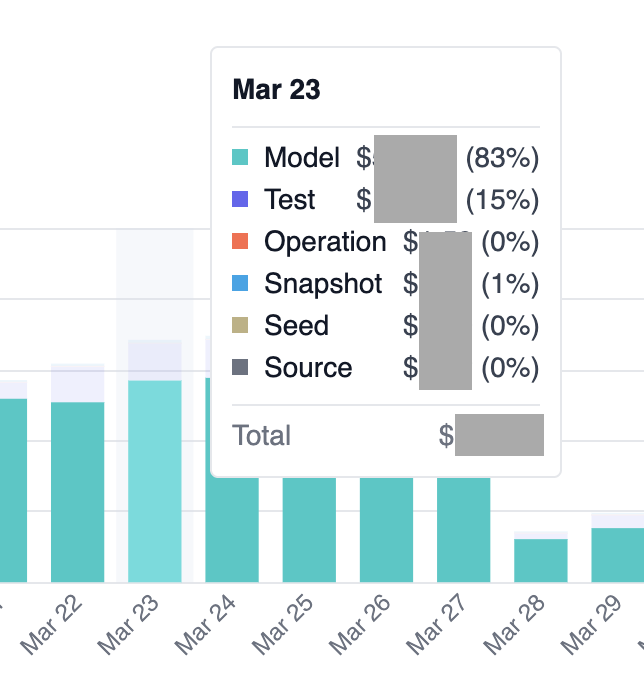
When you filter by resources, you get valuable insights into how your projects’ resources impact warehouse costs. Use the dropdown menu or click the colored squares to add or remove resource types from the bar graph and list view.
- Filter information by following resource types:
- Model
- Test
- Operation
- Snapshot
- Seed
- Source
- Filter the graph view by project and/or resource type.
- View a detailed breakdown of your resources and the costs associated. You can filter by resource name and/or type and sort by each column.
- Click into a resource to view its lineage and how much each node impacts your costs. You can even open the resource in dbt Explorer from this view to better understand your metadata!
Environment view
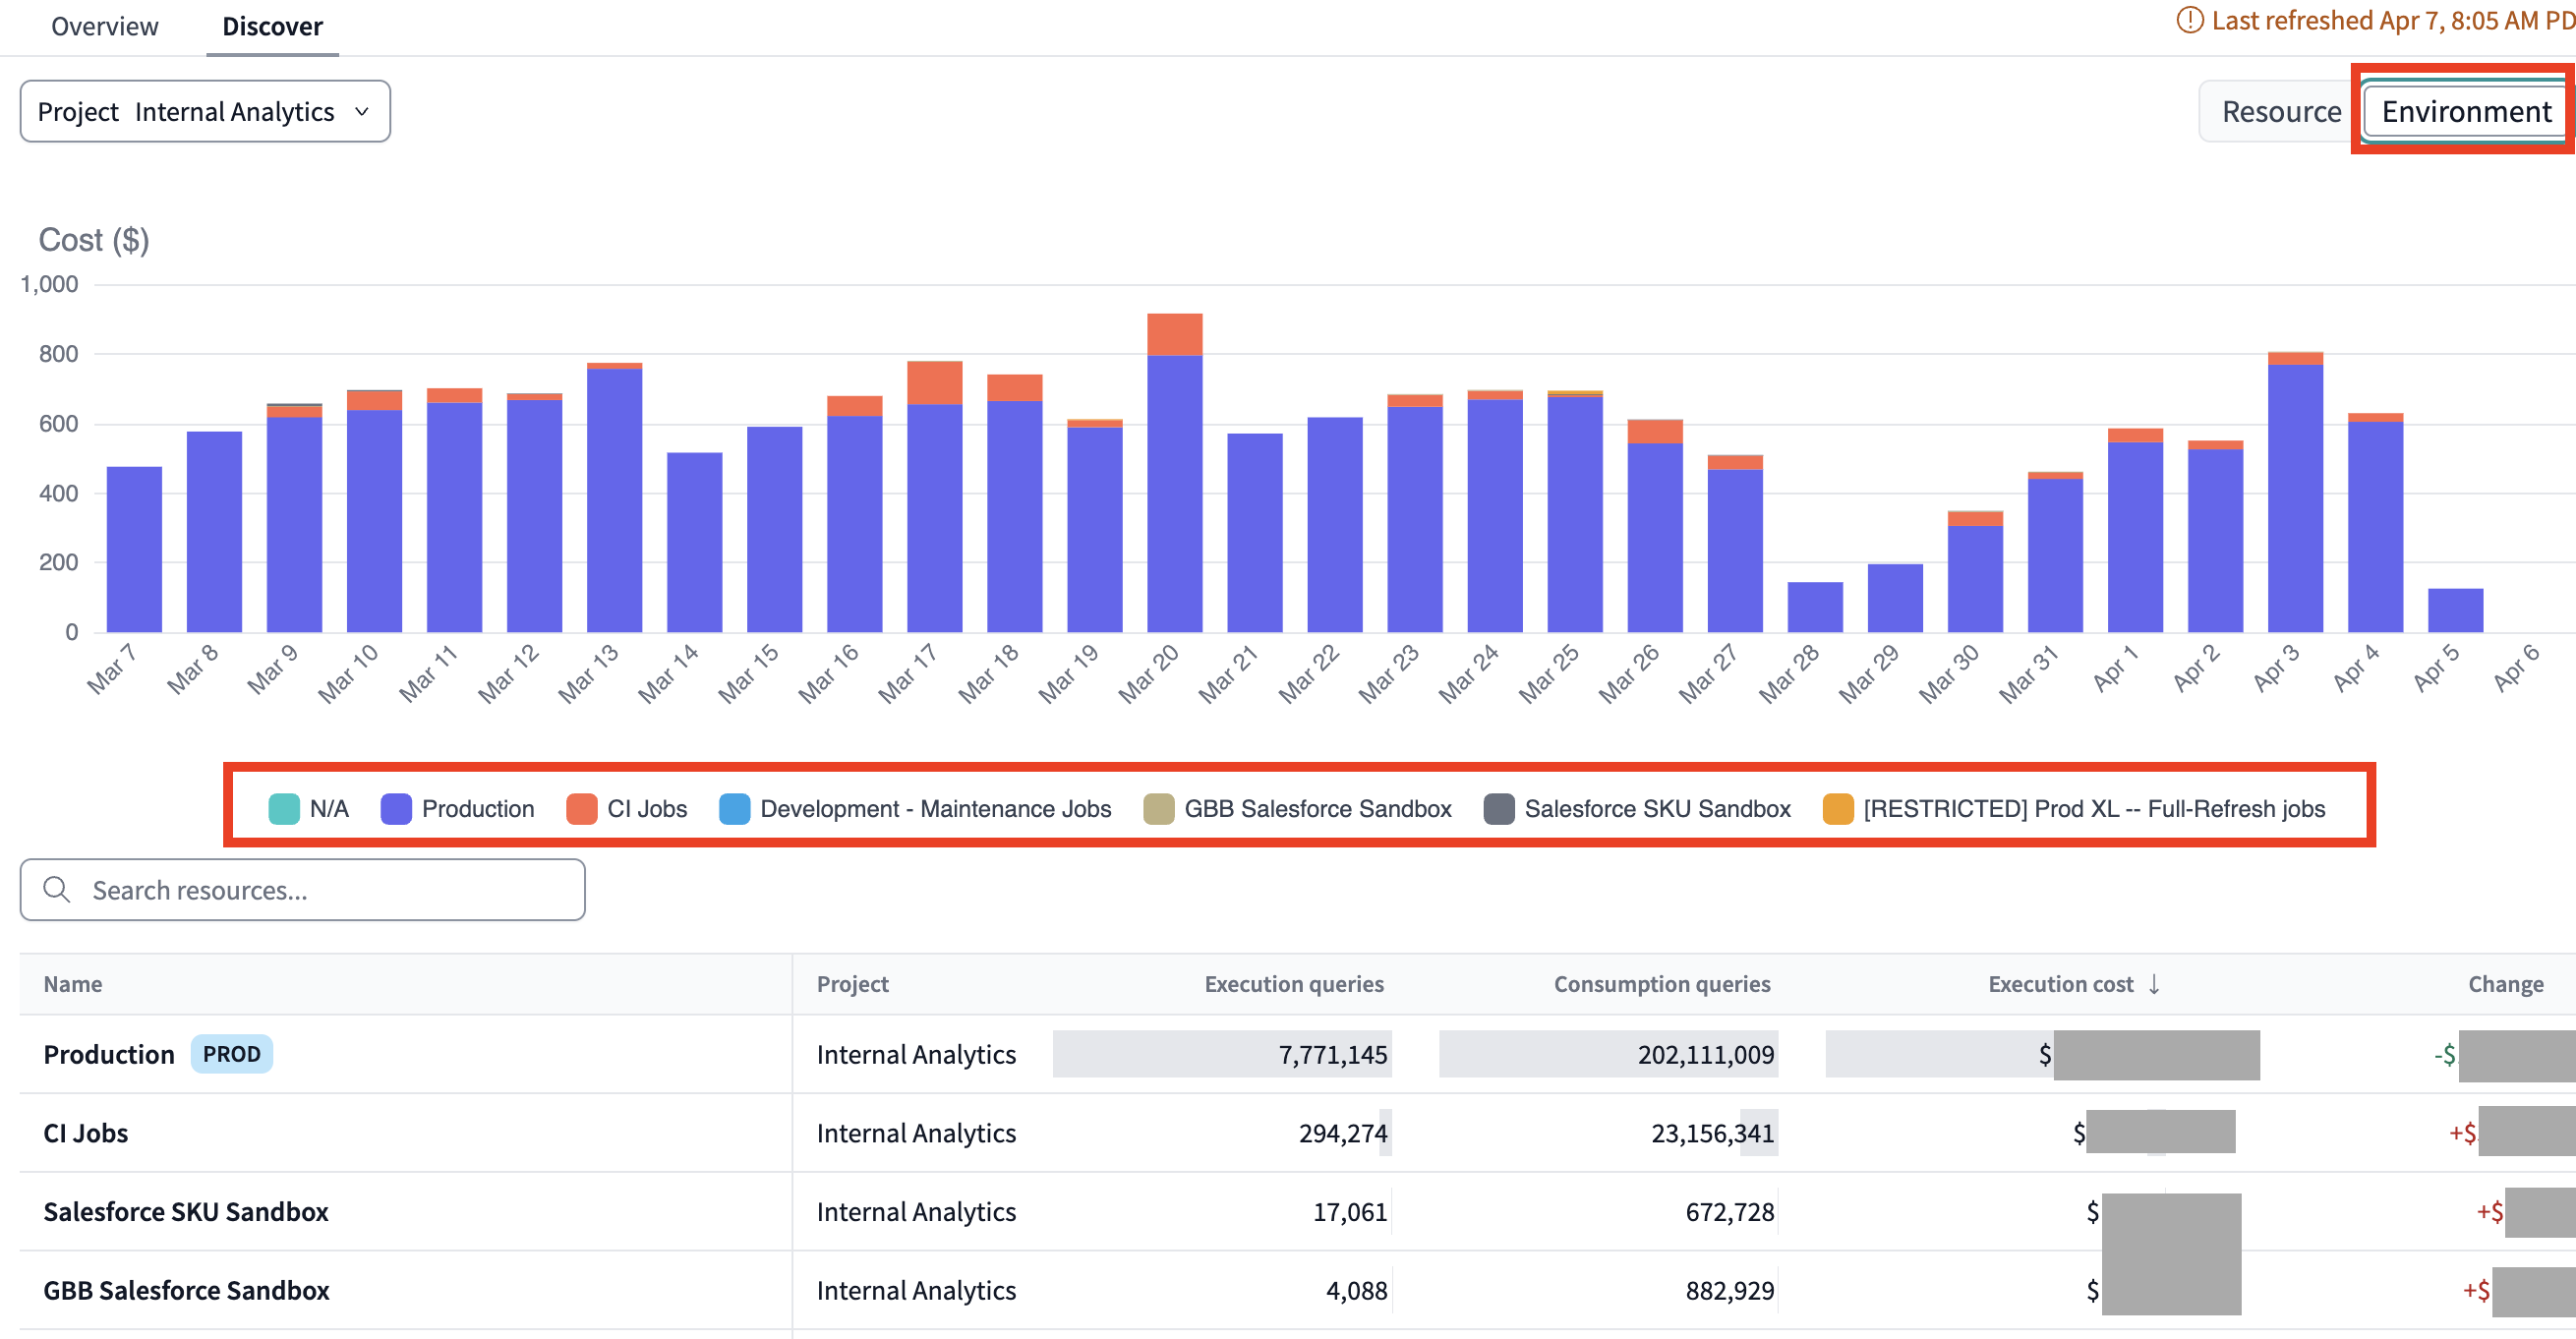
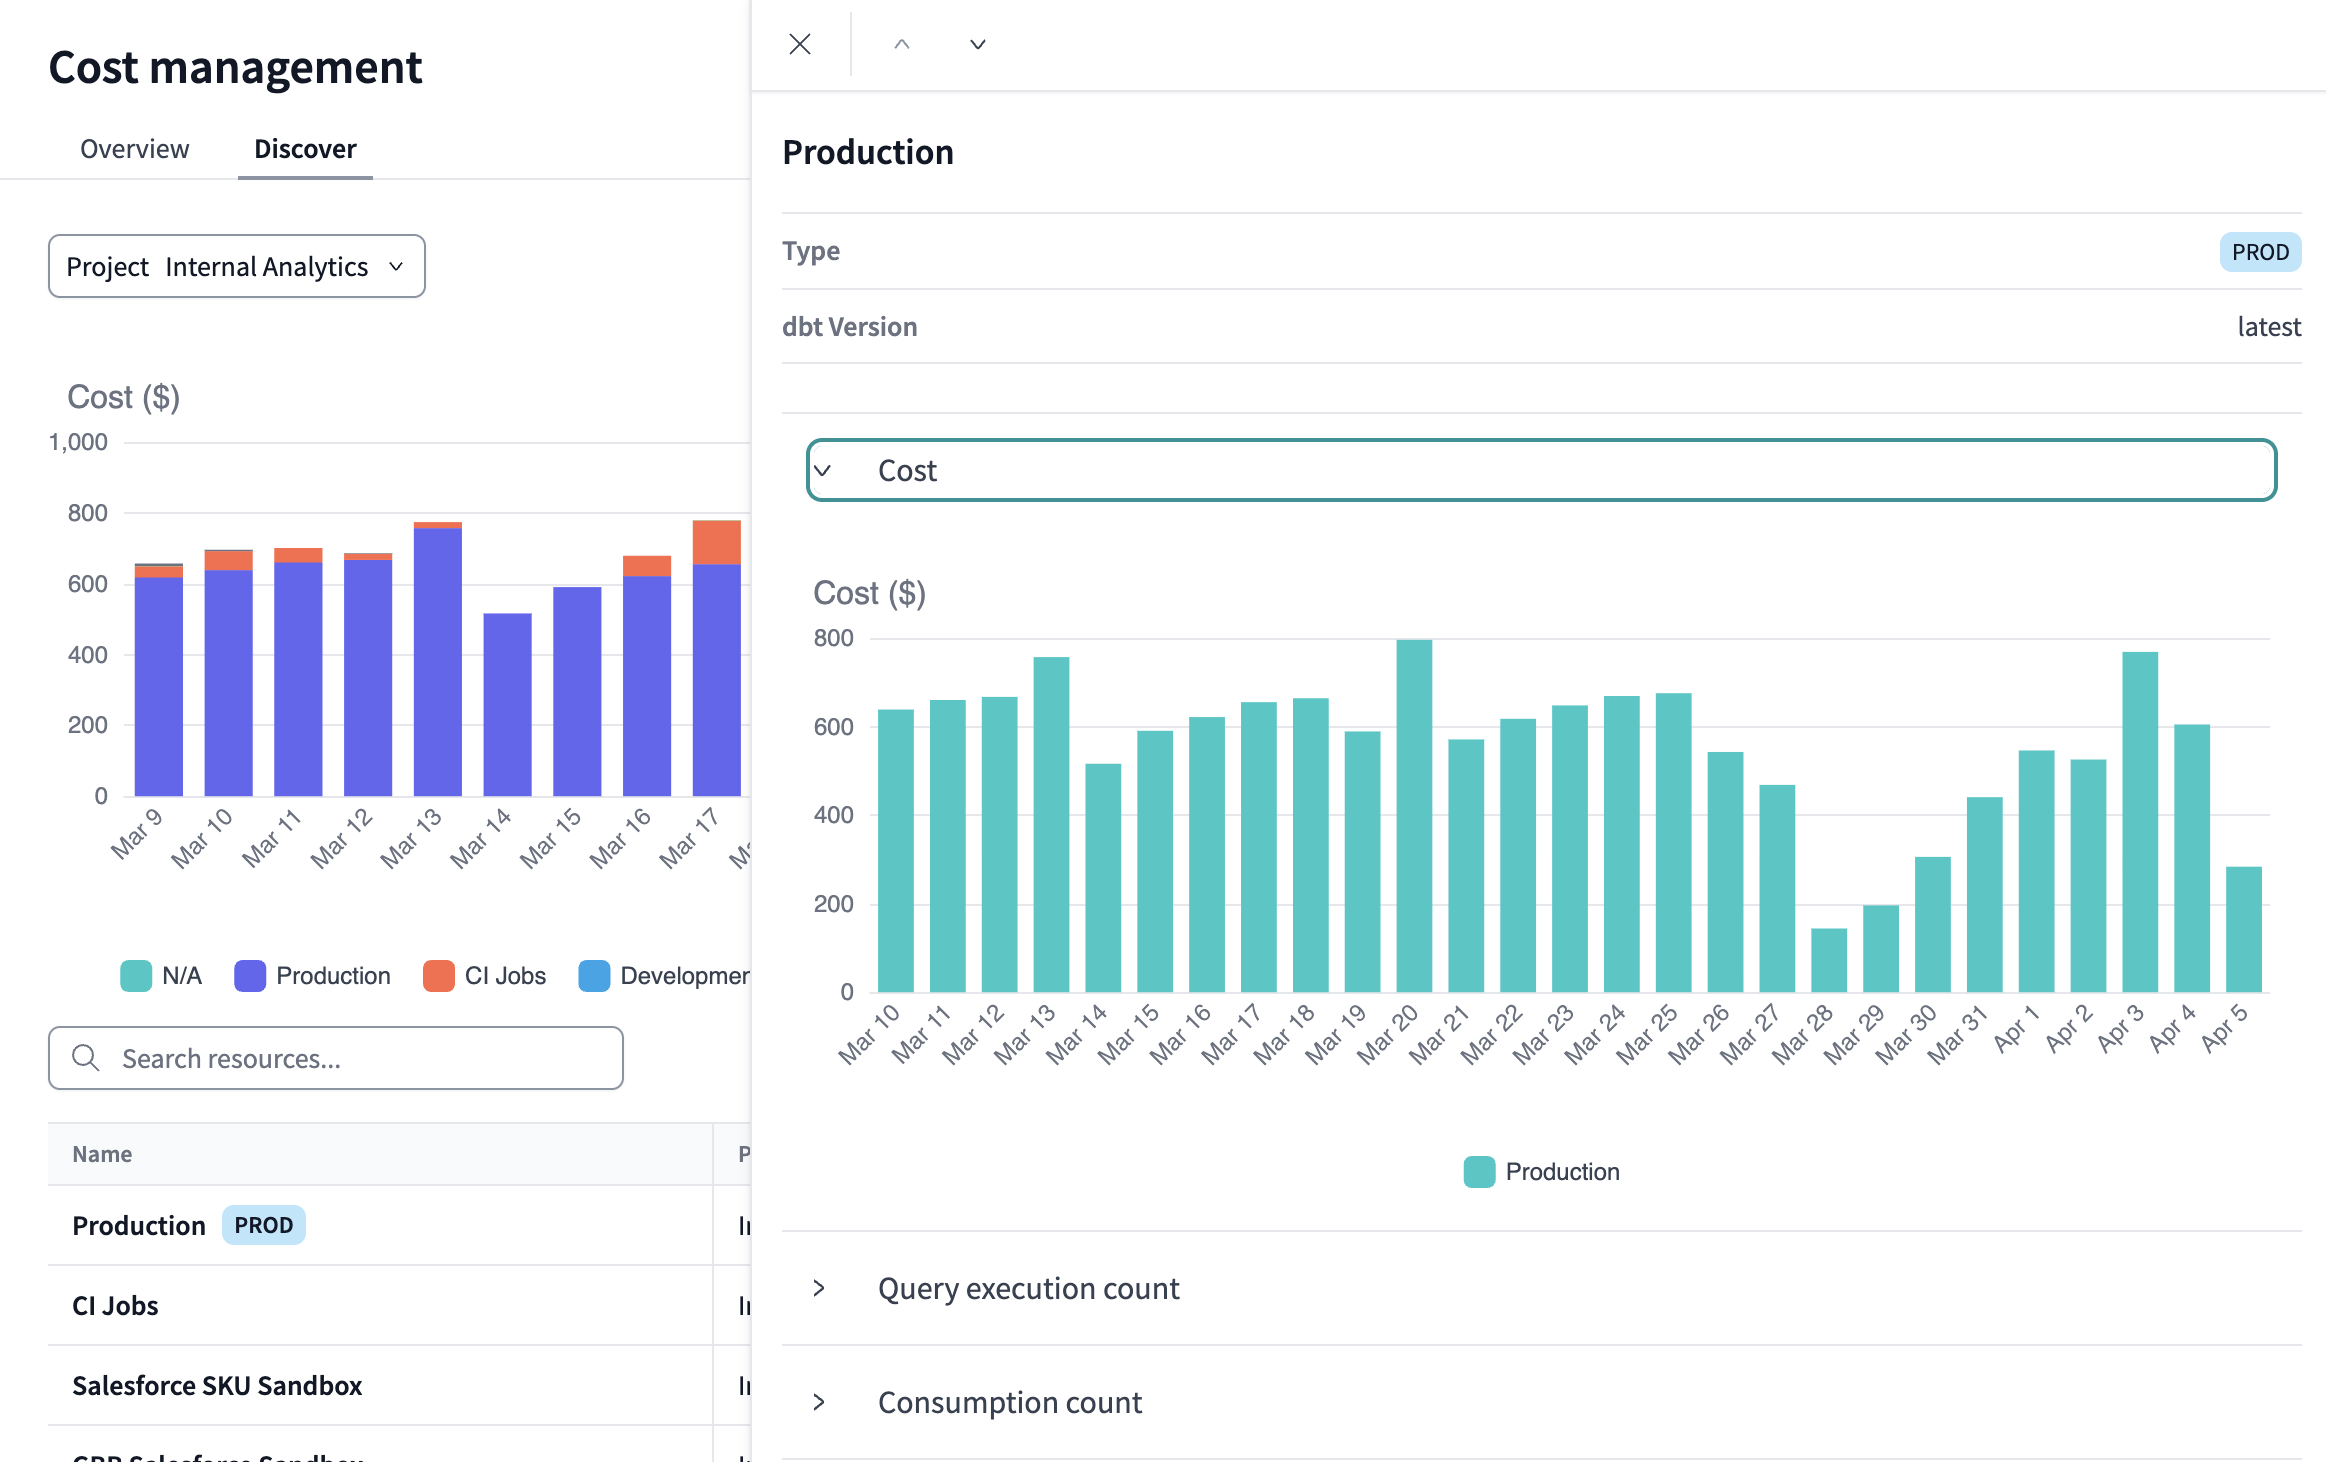
When you filter by environment, select a project to view more detailed information about how each environment type impacts your warehouse costs.
- The list view will mark your production environment with a
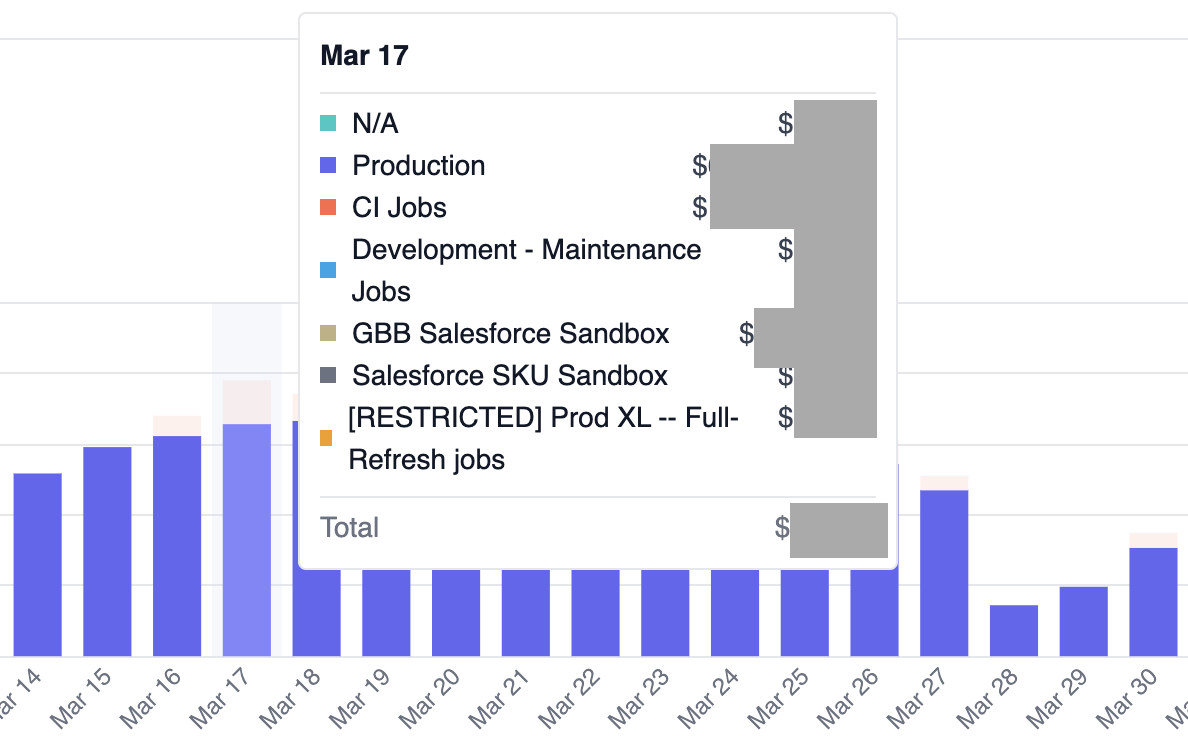
PRODicon. - Click a colored square next to an environment name to add or remove it from the bar graph view.
- Hover over a bar to view the cost breakdown for each environment.
- Sort the list view by any of the available fields. Click an item in the list view for detailed bar graph breakdowns of cost, query execution count, and consumption count.
